About the Sensor:
DS18B20 is a digital temperature sensor. It measures the temperature of the sensor’s surroundings. This sensor is 1-wire, which means that the entirety of its data can be transferred over 1 digital pin to the Arduino. Its temperature output is recorded in 9 to 12 bit resolution depending on user preference, which will impact its precision. By default, resolution is 12 bit, which means .0625 C precision.
The sensor features a temperature detection range from -55°C to +125°C / -67°F to +257°F with ±0.5°C Accuracy from -10°C to +85°C.
One cool feature about this sensor is that each sensor is assigned a random 64-bit serial code, meaning you can have several DS18B20 sensors providing data to the same data pin and still distinguish between them.
The version I’m documenting is in a pre-waterproofed and heat-shrinked casing, although the sensor can also be found with just its sensor.
Setup:
The sensor’s pin outputs are shown below. For the non-waterproofed version, pins follow the same order while the flat face is facing you.
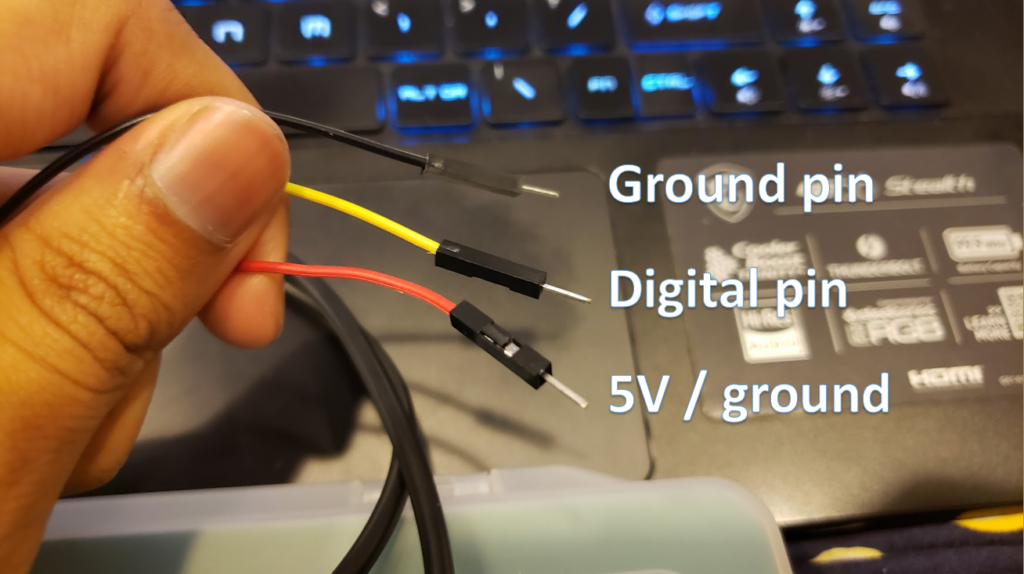
The sensor can be set up in 2 configurations: normal 3-wire connection mode or parasite mode, where power is provided over the data line.
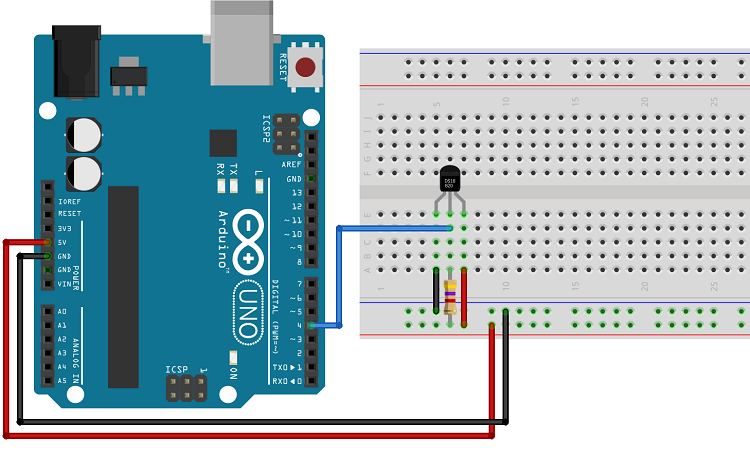
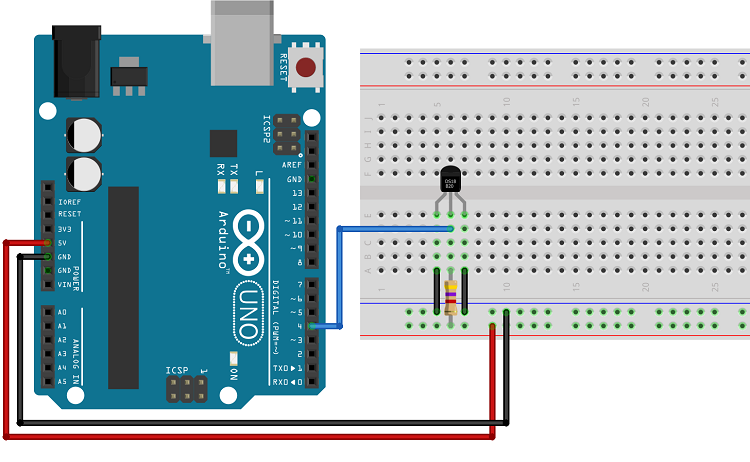
You’ll note that both modes have a 4.7k Ohm resistor between the signal and power pins—this pull-up resistor is essential to keep data transfer stable and minimize noise. Both modes also share the same code. The main benefit of this feature is reducing power draw for more complex circuits.
Code:
The code that allows multiple sensors to coexist on one data pin is rather complicated, and Miles Burton wrote a library that simplifies the process. This library is DallasTemperature.h, and you need to install it (alongside its dependency, OneWire) to allow this code to work.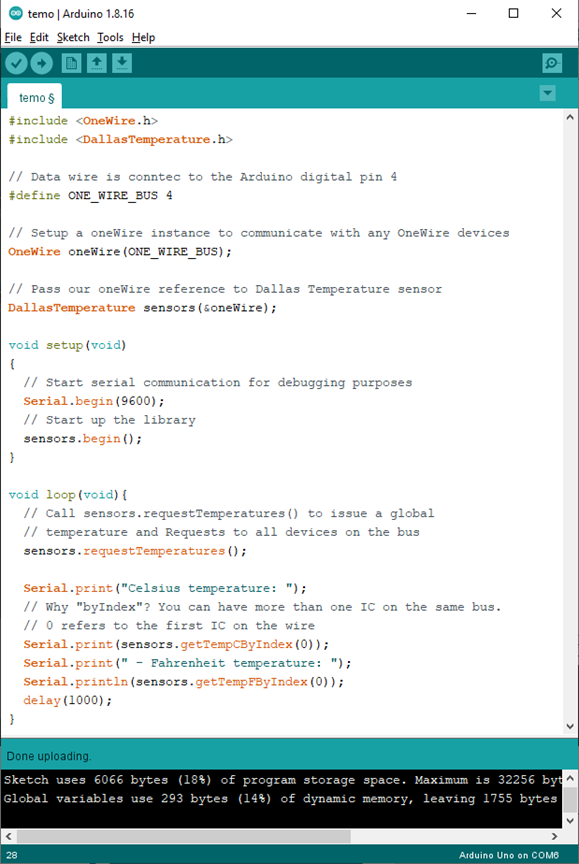
The code is set up to first create a oneWire object and then pass it on to the DallasTemperature library. We then open up a serial connection, and print the pulled temperature on a second by second basis.
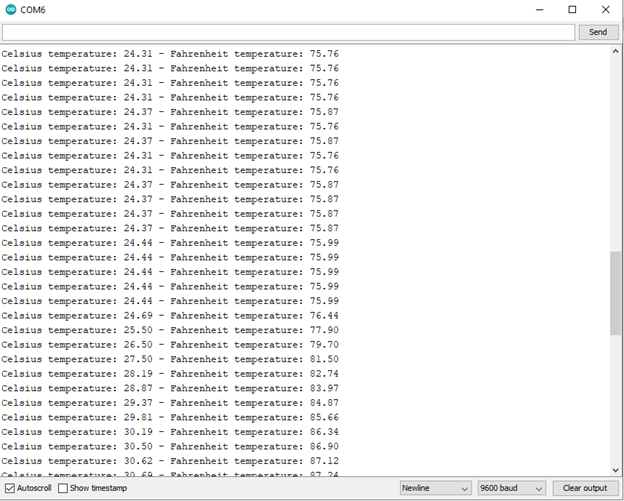
The plotter can also be changed into a graph, although I struggled to get its scale into a usable size.
This is definitely one of the most elegant ways I’ve seen temperature sensors handled, and I think the library does a great job of being approachable.
My demo:
I used the standard 3-wire configuration.
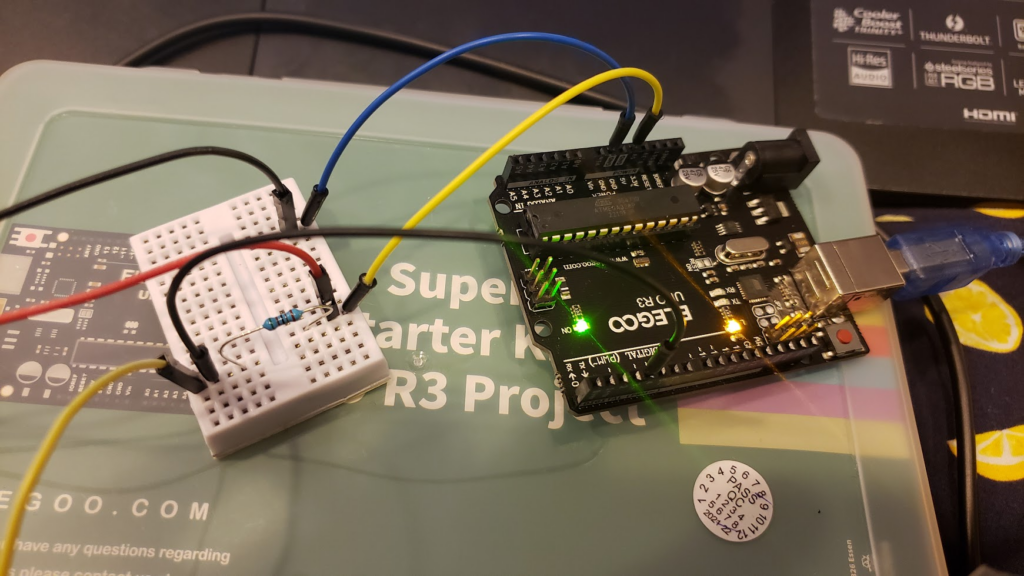
Here’s a video of my setup at work.
Resources:
Technical datasheet
RandomNerd Tutorial
LastMinuteEngineers Tutorial
DallasTemperature Library
OneWire Library
Leave a Reply